Posted by Beth on Friday, Feb 27, 2015
Even though you wouldn't know it by looking outside Spring really is on the way. Which means many of us have started thinking and dreaming about our gardens.
As most people know, there are two baisc types of garen plants: annuals and perennials. Annuals live fast and die pretty. They last for only one growing season, and you have to replant them again next year. Perennials are the mainstays in the garden. They come back year after year. Many don't hit their prime for two or three years, making year-round care of the plant important. One of the most important things to consider before purchasing a perennial for your garden is what its hardiness zone rating is, to know if it will survive the winter in your garden.
The US Dept. of Agriculture Plant Hardiness Zone Map is now the standard device used to label plants in the US.
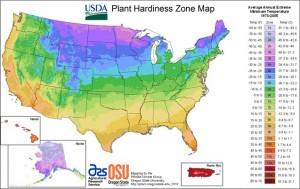
It represents the average annual minimum temperatures in 11 zones which vary in ten-degree differences. Each main zone is further divided into two sections, A and B, based on 5-degree differences. The map is now interactive. You can enter your zip code or state and it will tell you which zone you are in. You can also click on a state on the map and a popup map will appear showing the zones as well as county lines, major cities and rivers. Click here to try it out.
A bit of history:
The earliest versions of national hardiness maps were developed in the 1920's and 1930's by a variety of groups, most notably the Arnold Arboretum at Harvard University. The first USDA Hardiness Zone map was published in 1960 and updated in 1965. Because it used a different temperature scale for its divisions than the Arnold Arboretum map, it often led to confusion for gardeners rather than clarity. The USDA map would not be updated again until 1990 when it underwent a huge overhaul, using data collected between 1974 and 1986. Additional zones were added to include Canada and Northern Mexico as well as Alaska and Hawaii. Th 1990 map standardized its division s into the well-known 10 and 5 degree division, and became the default hardiness zone map in the US.
There is one big drawback to the USDA Plant Hardiness Zone Map however, it deals with only the average minimum temperatures. It does not take into account summer weather at all. Heat, humidity and rainfall are also just as important to the survival of a garden plant, and all that information is found on plant tags as well. But where can you find maps that give you this information?
One of the best sources of this type of information is the PRISM Climate Group at Oregon State University. In fact, the USDA used much of their winter data in the most recent overhaul of the Hardiness Zone Map. From their web site: "The PRISM Climate Group gathers climate observations from a wide range of monitoring networks, applies sophisticated quality control measures, and develops spatial climate datasets to reveal short- and long-term climate patterns."
"PRISMs homepage can be found here. From this page you can find lots of neat informational maps.
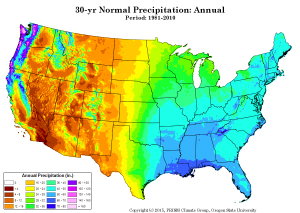
- The link to 30 Year Normals takes you to a map that compiles the data from 1981-2010, and you can adjust it to see precipitation or temperature and you adjust by month.
- The link to Gallery of State Maps takes you to a US map that you can then click on state by state to see the average annual precipitation (1981-2010) by state.
Combining information from The USDA Plant Hardiness Zone Map and the PRISM maps, can give you a lot of information about where you live and the types of plants the will probably work best in your area. Unless you are dealing with a microclimate. But that's another topic for another blog post. Happy Gardening!
About the Author

Title: Program Librarian
Where you'll see me in the library: I work at the Information Desk, the Help Desk and in the Digital Media Lab during Drop-in Tech Help. I teach some of the Genealogy workshops and I'll be at most of the Library Events & Programs for adults too, so I'm pretty much everywhere.
What do you like to read? I read all... more
Added by Beth